The state is yours to lead.
Historical events are sourced. Policy consequences are explicitly modeled, not reported as polling.
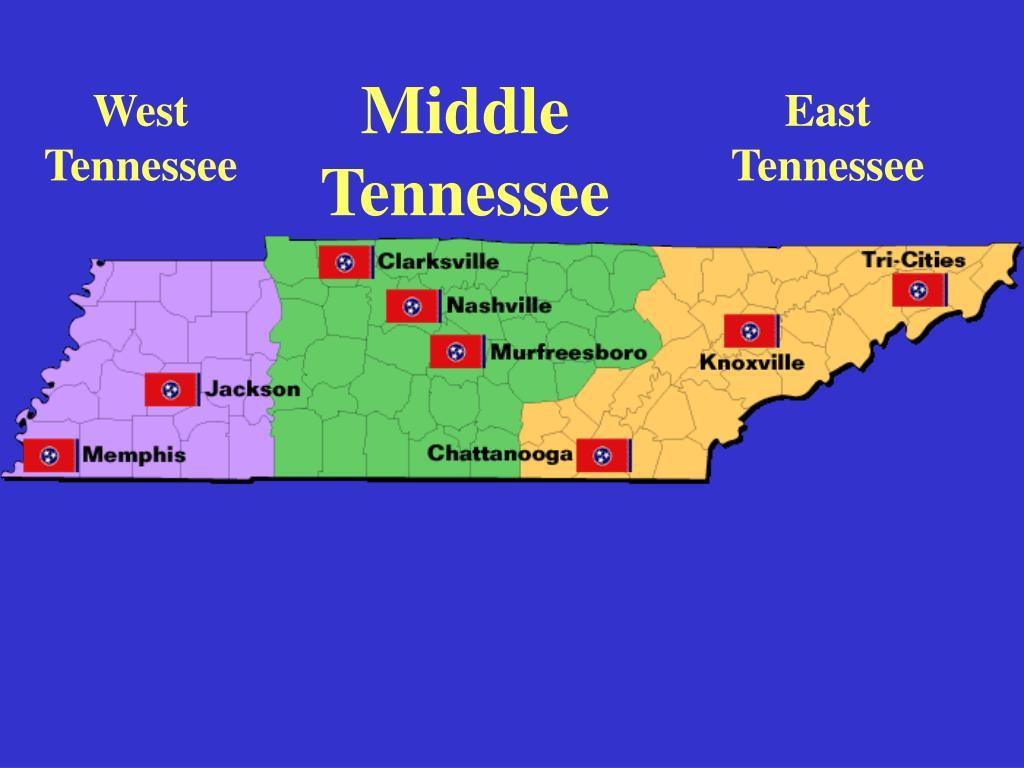
West, Middle and East Tennessee
Explore how decisions can affect communities across Tennessee’s three grand divisions, from Memphis and Jackson to Nashville, Chattanooga, Knoxville and the Tri-Cities.
Scenario begins January 2018
Illustrative index, not public polling
Only user-entered initiative/personnel estimates; not a full state budget
One decision required each month
What changed because of your choices?
These are game indicators, not real polling or official state financial forecasts. Compare them after each decision to see the direction your administration is moving.
At the starting point · 0 points from 50
Save a policy choice to estimate passage odds.
No fiscal estimate entered · cumulative entered amounts
Near the starting point · scenario score, not a forecast
Your policy trajectory
Each bar shows the combined economic and quality-of-life score for a recorded monthly decision.
Go to Policy decisions, choose an option, and save it. Return here to see the political, legislative, and financial indicators update.
Where should the next budget dollar go?
Fast-growing counties report congestion and housing pressure, while rural counties prioritize bridge condition and reliable routes to work.
Major federal individual and corporate tax provisions begin taking effect, shaping the national tax and business climate debate.
Read sourceNational → Tennessee
Federal Tax Cuts and Jobs Act takes effect
Major federal individual and corporate tax provisions begin taking effect, shaping the national tax and business climate debate.
Open source record Historical fact and source are separate from modeled impact.Bill Haslam administration
Tennessee economic indicators
Observed annual indicators are historical context, not proof that a governor’s decision caused a change. Recent years may be revised by the agencies.
Budget pressure, reserves and revenue context
These are current reference points for FY 2026–27, not values to retroactively apply to earlier simulated years. The scenario ledger includes only player-entered estimates; it is not a full fiscal note or official forecast.
The state’s July revenue report said tax collections were $418.2 million above the budget estimate, while noting that final accrual adjustments could change the recorded result. A temporary revenue overage does not automatically make a recurring program affordable.
Read official revenue releaseNo dollar estimate entered
Share of $58.3B reference budget: 0.000%. This is a rough scale comparison only. State whether each estimate is one-time or recurring in the initiative description.
Which executive decision contributes to each metric?
Each row shows direct formula contributions for recorded executive strategy decisions included through this month. These are not causal estimates; dashboards combine them with other inputs and may apply scaling or caps.
Budget classification follows each decision’s saved timing. One-time estimates count once; recurring annual and multi-year/phased estimates multiply by elapsed annual periods as a simple scenario convention; savings/revenue are negative amounts. Unknown/not-estimated and no-direct-impact entries should not be interpreted as verified zero cost. Reception contribution is publicImpact × 0.3 before the overall 0–100 cap; the complete formula also includes policy decisions, personnel, ideology, and rounding. Passage contribution is legislativeImpact × 0.15 before the final 15–88 cap; this is a model score, never a vote count. County attribution is separately reconciled to each county’s displayed index.
Uncapped score = 50 baseline + policy-decision term + personnel term + executive-strategy term + ideology term. Final reception = rounded score capped at 0–100.
All contributions are formula arithmetic on scenario inputs. The reception index is not polling or a measured level of public support.
Governing, month by month
Consequences carried forward
Units are relative model scores, not dollar amounts or observed social/economic outcomes.
Modeled party support gained or lost
These are illustrative support-index shifts inferred from each initiative’s policy trade-offs and your governor settings. They are not voter surveys, election forecasts, party registrations, or actual seat changes. National-policy events are shown as context, not assumed to affect all Tennesseans in the same way.
Public reaction: record dated, representative polling with field dates, sample size, question wording, sponsor, and methodology; separately log public testimony, organized statements, and election results without treating any one source as statewide opinion. No measured public-opinion shift is entered here without that evidence.
General Assembly reaction: track bill numbers, sponsors, committee referrals and votes, amendments, roll-call totals, floor votes, final enactment or veto, and effective dates. These are observable legislative actions, not proof of private motives or public approval.
Documented example — 2025 Education Freedom Act funding bill (SB6005 / HB6005): official bill history records Senate passage 27–6 and House passage 81–14 on January 30, 2025; SB6005 was signed February 12 and became Public Chapter 4 on February 25, 2025. This documents legislative action, not the public-opinion effect of the law. The Governor’s description of the special-session agenda is an attributed administration statement, not independent polling.
Do not attribute a vote, polling shift, or election result to a cabinet appointment or policy change without a defensible link. Keep observed facts separate from simulated public-reception and party-support indices.
Record the first initiative to begin tracking modeled support changes.